Beckham County, Oklahoma
Beckham County | |
|---|---|
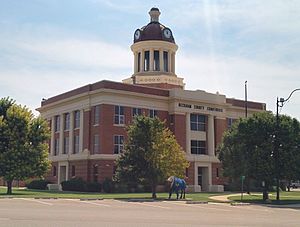
 Beckham County Courthouse, Sayre, Oklahoma 2015 | |
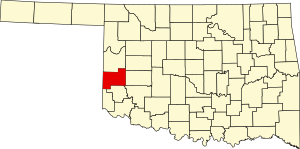
 Location within the U.S. state of Oklahoma | |
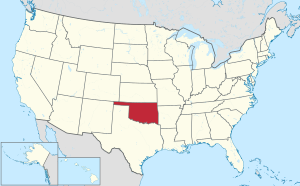
 Oklahoma's location within the U.S. | |
| Coordinates: 35°16′N 99°41′W / 35.26°N 99.69°W | |
| Country | |
| State | |
| Founded | November 16, 1907 |
| Named for | J. C. W. Beckham |
| Seat | Sayre |
| Largest city | Elk City |
| Area | |
| • Total | 904 sq mi (2,340 km2) |
| • Land | 902 sq mi (2,340 km2) |
| • Water | 2.1 sq mi (5 km2) 0.2% |
| Population (2020) | |
| • Total | 22,410 |
| • Density | 25/sq mi (9.6/km2) |
| Time zone | UTC−6 (Central) |
| • Summer (DST) | UTC−5 (CDT) |
| Congressional district | 3rd |
| Website | beckham |
Beckham County is a county located on the western border of the U.S. state of Oklahoma. As of the 2020 census, the population was 22,410.[1] Its county seat is Sayre.[2] Founded upon statehood in 1907, Beckham County was named for J. C. W. Beckham, who was Governor of Kentucky[3] and the first popularly elected member of the United States Senate from Kentucky. Beckham County comprises the Elk City, OK Micropolitan Statistical Area.
History
[edit]In 1855, the U.S. government leased the western part of the formerly reserved Choctaw and Chickasaw Nation lands, which became known as the Leased District. After the Civil War, the two nations were forced to cede the land to the US government under terms of new treaties required because they had been allies of the Confederacy. Under the treaties they were also required to emancipate their slaves and provide them with citizenship in their nations.
In 1869, the former Leased District was designated by the President as the Cheyenne and Arapaho Indian Reservation, following their removal from further west. During the 1880s, Texas cattlemen leased grazing land from the Cheyenne and Arapaho.
Under the Dawes Act of 1891, the government split up such communal lands, allocating plots to individual households of various tribes. After distribution was made, the government declared any additional lands on the reservation to be "surplus". In 1892, the government opened such surplus land to settlement by non-Indians, attracting numerous European-American settlers and immigrants. The area was designated as County F in the newly created Oklahoma Territory, until it was renamed Roger Mills County.
In 1896, Greer County, Texas was transferred to the Oklahoma Territory and became Greer County, Oklahoma, following a United States Supreme Court decision in the United States v. State of Texas boundary dispute case. At statehood, portions of land from both Roger Mills and Greer County were joined to form Beckham County. Sayre was named as the temporary county seat. A 1908 election after statehood made Sayre, Oklahoma the permanent seat.[3]
In 1910, a piece of southern Beckham County was returned to Greer County, Oklahoma.
The Gannett survey of 1927-1929 found that the true 100th Meridian, the boundary between Texas and western Oklahoma, was 3,800 feet (1,200 m) farther east than previously thought. The US Supreme Court ruled on March 17, 1930 that the strip of land must be returned to Texas, thereby reducing Beckham County's area slightly.[3]
Geography
[edit]According to the U.S. Census Bureau, the county has a total area of 904 square miles (2,340 km2), of which 902 square miles (2,340 km2) is land and 2.1 square miles (5.4 km2) (0.2%) is water.[4] The county is drained by the North Fork of the Red River and its tributaries: the Timber, Sweetwater, and Buffalo creeks. The northwestern part of the county is part of the High Plains. The rest of the county is part of the Gypsum Hills physiographic region.[3]
Major highways
[edit]Adjacent counties
[edit]- Roger Mills County (north)
- Custer County (northeast)
- Washita County (east)
- Kiowa County (southeast)
- Greer County (south)
- Harmon County (southwest)
- Collingsworth County, Texas (west)
- Wheeler County, Texas (northwest)
Demographics
[edit]| Census | Pop. | Note | %± |
|---|---|---|---|
| 1910 | 19,699 | — | |
| 1920 | 18,989 | −3.6% | |
| 1930 | 28,991 | 52.7% | |
| 1940 | 22,169 | −23.5% | |
| 1950 | 21,627 | −2.4% | |
| 1960 | 17,782 | −17.8% | |
| 1970 | 15,754 | −11.4% | |
| 1980 | 19,243 | 22.1% | |
| 1990 | 18,812 | −2.2% | |
| 2000 | 19,799 | 5.2% | |
| 2010 | 22,119 | 11.7% | |
| 2020 | 22,410 | 1.3% | |
| U.S. Decennial Census[5] 1790-1960[6] 1900-1990[7] 1990-2000[8] 2010[9] | |||
As of the 2010 United States census,[10] there were 22,119 people, 8,163 households, and 5,485 families residing in the county. The population density was 24.5 people per square mile (9.5 people/km2). There were 9,647 housing units at an average density of 10.7 units per square mile (4.1/km2). The racial makeup of the county was 85% white, 4% black or African American, 2.8% Native American, 0.8% Asian, less than 0.01% Pacific Islander, 4.6% from other races, and 2.8% from two or more races. Twelve percent of the population was Hispanic or Latino. By 2020, its population was 22,410.[1]
In 2010, there were 8,163 households, out of which 34.6% included children under the age of 18, 50.9% were married couples living together, 11.1% had a female householder with no husband present, 5.1% had a male householder with no wife present, and 32.8% were non-families. Individuals living alone accounted for 27.6% of households and 11.2% had someone living alone who was 65 years of age or older. The average household size was 2.48 and the average family size was 3.02. In the county, the population was spread out, with 24.1% under the age of 18, 9.9% from 18 to 24, 28.1% from 25 to 44, 25.2% from 45 to 64, and 12.7% who were 65 years of age or older. The median age was 35.4 years. For every 100 females there were 105 males. For every 100 females age 18 and over, there were 112 males.
The median income for a household in the county was $45,726, and the median income for a family was $57,316. Males had a median income of $42,470 versus $27,075 for females. The per capita income for the county was $21,470. More than 12% of families and 15% of the population were below the poverty line, including 26% of those under age 18 and 14.4% of those age 65 or over.
Politics
[edit]| Voter Registration and Party Enrollment as of May 31, 2023[11] | |||||
|---|---|---|---|---|---|
| Party | Number of Voters | Percentage | |||
| Democratic | 2,300 | 20.09% | |||
| Republican | 7,328 | 64.01% | |||
| Others | 1,821 | 15.90% | |||
| Total | 11,449 | 100% | |||
| Year | Republican | Democratic | Third party(ies) | |||
|---|---|---|---|---|---|---|
| No. | % | No. | % | No. | % | |
| 2020 | 6,767 | 85.14% | 1,048 | 13.19% | 133 | 1.67% |
| 2016 | 6,308 | 83.53% | 960 | 12.71% | 284 | 3.76% |
| 2012 | 5,508 | 79.54% | 1,417 | 20.46% | 0 | 0.00% |
| 2008 | 5,772 | 78.03% | 1,625 | 21.97% | 0 | 0.00% |
| 2004 | 5,454 | 73.85% | 1,931 | 26.15% | 0 | 0.00% |
| 2000 | 4,067 | 62.26% | 2,408 | 36.86% | 57 | 0.87% |
| 1996 | 2,912 | 44.45% | 2,797 | 42.70% | 842 | 12.85% |
| 1992 | 2,913 | 37.25% | 2,947 | 37.69% | 1,960 | 25.06% |
| 1988 | 3,463 | 50.08% | 3,388 | 48.99% | 64 | 0.93% |
| 1984 | 5,005 | 65.39% | 2,601 | 33.98% | 48 | 0.63% |
| 1980 | 3,637 | 51.13% | 3,298 | 46.37% | 178 | 2.50% |
| 1976 | 2,351 | 33.90% | 4,530 | 65.32% | 54 | 0.78% |
| 1972 | 4,472 | 71.72% | 1,608 | 25.79% | 155 | 2.49% |
| 1968 | 2,935 | 42.92% | 2,354 | 34.42% | 1,550 | 22.66% |
| 1964 | 2,557 | 38.32% | 4,115 | 61.68% | 0 | 0.00% |
| 1960 | 4,258 | 61.01% | 2,721 | 38.99% | 0 | 0.00% |
| 1956 | 3,194 | 47.28% | 3,561 | 52.72% | 0 | 0.00% |
| 1952 | 4,504 | 53.14% | 3,972 | 46.86% | 0 | 0.00% |
| 1948 | 1,310 | 22.38% | 4,544 | 77.62% | 0 | 0.00% |
| 1944 | 2,034 | 35.96% | 3,608 | 63.78% | 15 | 0.27% |
| 1940 | 2,148 | 31.67% | 4,598 | 67.79% | 37 | 0.55% |
| 1936 | 1,352 | 19.94% | 5,372 | 79.23% | 56 | 0.83% |
| 1932 | 892 | 12.98% | 5,979 | 87.02% | 0 | 0.00% |
| 1928 | 3,810 | 62.36% | 2,201 | 36.02% | 99 | 1.62% |
| 1924 | 1,357 | 30.93% | 2,496 | 56.90% | 534 | 12.17% |
| 1920 | 1,755 | 36.99% | 2,347 | 49.46% | 643 | 13.55% |
| 1916 | 527 | 16.09% | 1,850 | 56.49% | 898 | 27.42% |
| 1912 | 648 | 20.84% | 1,566 | 50.37% | 895 | 28.79% |
Economy
[edit]The county economy has been based mainly on farming and raising livestock. The major crops have been cotton, wheat, alfalfa, kafir, milo maize, and broomcorn. Mineral industries have occasionally been significant. In the early 20th century, there was some salt production. A limited amount of oil and gas production began in the 1920s.[3]
Communities
[edit]Cities
[edit]Towns
[edit]- Carter
- Sweetwater (partially in Roger Mills County)
- Texola
Unincorporated communities
[edit]Education
[edit]School districts include:[13]
NRHP sites
[edit]The following sites in Beckham County are listed on the National Register of Historic Places:
|
|
References
[edit]- ^ a b "Beckham County, Oklahoma". United States Census Bureau. Retrieved May 9, 2023.
- ^ "Find a County". National Association of Counties. Archived from the original on July 12, 2012. Retrieved June 7, 2011.
- ^ a b c d e Wilson, Linda D. "Beckham County," Encyclopedia of Oklahoma History and Culture, 2009. Accessed March 28, 2015.
- ^ "2010 Census Gazetteer Files". United States Census Bureau. August 22, 2012. Retrieved February 18, 2015.
- ^ "U.S. Decennial Census". United States Census Bureau. Retrieved February 18, 2015.
- ^ "Historical Census Browser". University of Virginia Library. Retrieved February 18, 2015.
- ^ Forstall, Richard L., ed. (March 27, 1995). "Population of Counties by Decennial Census: 1900 to 1990". United States Census Bureau. Retrieved February 18, 2015.
- ^ "Census 2000 PHC-T-4. Ranking Tables for Counties: 1990 and 2000" (PDF). United States Census Bureau. April 2, 2001. Archived (PDF) from the original on March 27, 2010. Retrieved February 18, 2015.
- ^ "State & County QuickFacts". United States Census Bureau. Archived from the original on June 6, 2011. Retrieved November 8, 2013.
- ^ "U.S. Census website". United States Census Bureau. Retrieved January 31, 2008.
- ^ "Voter Registration Totals". OK Elections Interactive Statistics Beta. May 31, 2023. Retrieved June 25, 2023.
- ^ Leip, David. "Dave Leip's Atlas of U.S. Presidential Elections". uselectionatlas.org. Retrieved March 28, 2018.
- ^ "2020 CENSUS - SCHOOL DISTRICT REFERENCE MAP: Beckham County, OK" (PDF). U.S. Census Bureau. Retrieved October 13, 2024. - Text list


